
Razorback football returns in just over two weeks. The 2022 season figures to be one of the most hyped in years, given that the Hogs are coming off a 9-4 season and Outback Bowl win. Many key players are gone (Treylon Burks, Grant Morgan, for starters), but others return (KJ Jefferson, Bumper Pool, Jalen Catalon), and the Razorbacks hit the transfer portal hard, especially at wide receiver and on defense.
Here’s a quick look at the preseason content we have planned:
- Part I: Introduction & 2021 Season Recap
- Part II: Offense Preview
- Part III: Defense Preview
- Part IV: Schedule & Opponents
This first part will be short, just examining the 2021 season using our advanced stats.
2021 Recap
Confused? Be sure to check out the advanced stats glossary.
Let’s start by visualizing the 2021 season using the performance-by-game graph that we used for basketball season:
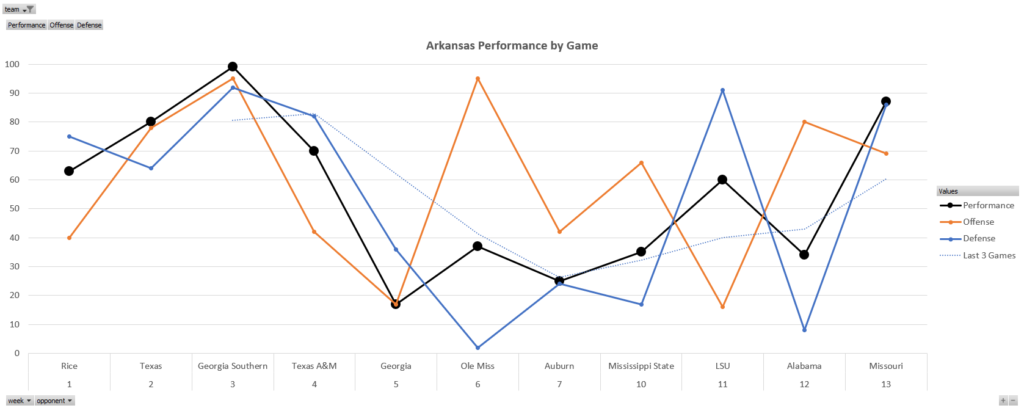
The black line is overall grade, on a scale of 0-100, based on how the Hogs did compared to how the average FBS team would do against that opponent. So a grade of 62 (for Rice) means that the Hogs played Rice better than 62% of FBS teams would.
You can see the hot 4-game start to the season, followed by a midseason swoon, and then steady improvement the rest of the way, closing with an emphatic performance against Mizzou. The Outback Bowl isn’t in this data, but it would probably be even higher than the Mizzou game.
The cause of the midseason swoon is clearly the defense (blue line). The Hogs graded at 63 or better in each of their first four games, and then Jalen Catalon got hurt. The Hog D then graded at 36, 2, and 24 against Georgia, Ole Miss, and Auburn. After the open week, the defense was still inconsistent, but better, even grading at a season-best 91 against LSU.
Here are some superlatives:
- Best overall performance: 99 vs Georgia Southern
- Best offensive performance: 95 vs Ole Miss
- Best defensive performance: 91 vs Georgia Southern and 91 vs LSU
- Worst overall performance: 18 vs Georgia
- Worst offensive performance: 18 vs LSU
- Worst defensive performance: 2 vs Ole Miss
- Most balanced performance: Georgia Southern, offense graded 93, defense graded 91
- Most uneven performance: Ole Miss, offense was 93 points better than defense (95 vs 2)
Early in the season, the Hogs’ success came from being more physical up front. Here are the run game stats from the Texas game (Hogs on left, Horns on right):
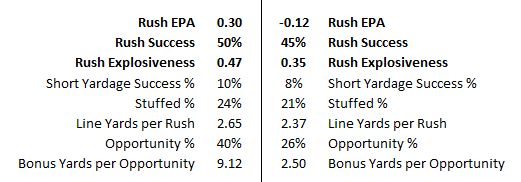
Note the bottom two stats: 40% of Arkansas’ rushes gained 6+ yards compared to 26% for Texas. And on runs where they did get 6+ yards, the Hogs averaged 9.1 additional yards per carry compared to 2.5 for Texas. That means that the best 40% of Arkansas runs averaged 15.1 yards per carry.
Later in the year, the Razorbacks weren’t quite able to dominate opponents to that degree. The injury to Catalon forced the Hogs to make some changes to their approach. Here are the same stats as above, except for the Mizzou game (again, Hogs on left, Mizzou on right):
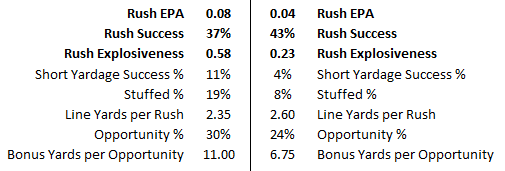
Here, you can see that the Razorback offense had a lower rushing success rate (50% to 37%) and a lower opportunity rate (40% to 30%), but generated even more big runs (the best 30% of Hog runs averaged 17.0 yards) to compensate. Defensively, the Hogs stuffed 21% of Texas runs but only 8% of Mizzou’s runs. However, the Hogs still limited big runs for Mizzou while creating them for themselves.
Ultimately, the Jefferson-to-Burks combo and the improvement of Jefferson as an efficient passer drove the offense’s improvement even after it stopped bullying opponents around like in the Texas game.
Here are the Hogs’ top 8 offensive contributors from 2021:
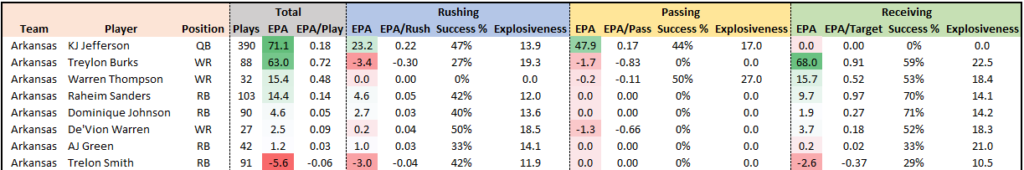
A couple observations:
- Jefferson and Burks were the undisputed offensive leaders. That’s not surprise, but the magnitude of their total offensive production is still striking. Jefferson was +48 as a passer and Burks was +68 as a receiver, meaning that Jefferson was -20 when not targeting Burks (that includes sacks, throwaways, and targets to other receivers).
- The eye test already confirmed this, but Trelon Smith made a smart decision to transfer. He filled in a critical gap in the 2020 offense when Rakeem Boyd was injured and struggling, but his inability to generate explosive runs meant that his ceiling was always lower than Rocket Sanders’ and Dominique Johnson’s.
Arkansas plays the macros well
The Moneyball revolution in baseball eventually evolved from “new” stats like on-base plus slugging and into a general analytical strategy aimed at maximizing your chance of winning. The modern consensus in baseball is to treat outs as a limited resource – you have 27 of them per game – and take players and make decisions that give you the most bang per out. “Small ball” – things like stealing bases and laying down bunts – does not give the best return per out, except in rare cases. So you don’t see much of it anymore.
Football and basketball have not yet reached that level of broad analytically-driven consensus on how the game should be approached, but both are getting there. The 3-point frenzy in the modern NBA emerged as a counter to the type of defenses that evolved following the 2001 elimination of the illegal defense rule that defined the Michael Jordan era of basketball. Generally speaking, those type of helper defenses allow for open 3-point looks, and open 3-point looks have a higher return per shot than any other type of attempt, at least at the NBA level.
In football, the consensus is not complete, but advanced stats nerds generally accept as fact that winning teams create more big plays than their opponents. Shocking results are often explained by big plays: either the winning team created more than expected, or they held the favorite to fewer than expected. Big play creation is usually associated with efficiency (staying on schedule, always moving forward), but not always, and that’s where the randomness comes in.
I don’t know whether Sam Pittman and his staff read all the modern analytics, but his teams in both 2020 and 2021 were very good at exactly what modern analytics says you need to do: the offense created big plays and defense didn’t allow very many. If that continues in 2022, it will again allow Arkansas to win some games it probably shouldn’t. The Hogs were out-gained in total offense against both Mississippi State and LSU but won both games. From an advanced stats standpoint, the Hogs were dominated by both Ole Miss and Alabama, but lost only at the very end in a close game.
Offensive inequality
There are a lot of ways to measure big plays. I like gini coefficient. In mathematics, gini coefficients find the inequality of a set of numbers. Economics use this to track what they call income inequality: a higher gini coefficient means that a small share of all their datapoints have most of the total income. In football terms, high inequality of total yards is a sign of an explosive offense. That means your biggest plays created the lion’s share of your total yards.
In 2021, Arkansas was 7-1 when they had a higher gini coefficient than their opponents (one loss: Alabama). They were 1-2 when they had a lower gini coefficient (one win: Mississippi State), and both teams had a gini of 0.36 against Ole Miss. The Hogs’ higher gini was the reason they beat LSU despite being out-gained, while higher ginis than Mizzou and Texas A&M turned what should have been fairly close games into lopsided wins.
If this trend persists, expect the Hogs to win one or two games that are unexpected, either because it is a big upset, or because the Hogs don’t actually play well but manage to pull it out in the end. That’s the value of playing the numbers: you put yourself in the best position to steal one.
Part 2 will cover the 2022 Razorback offense.