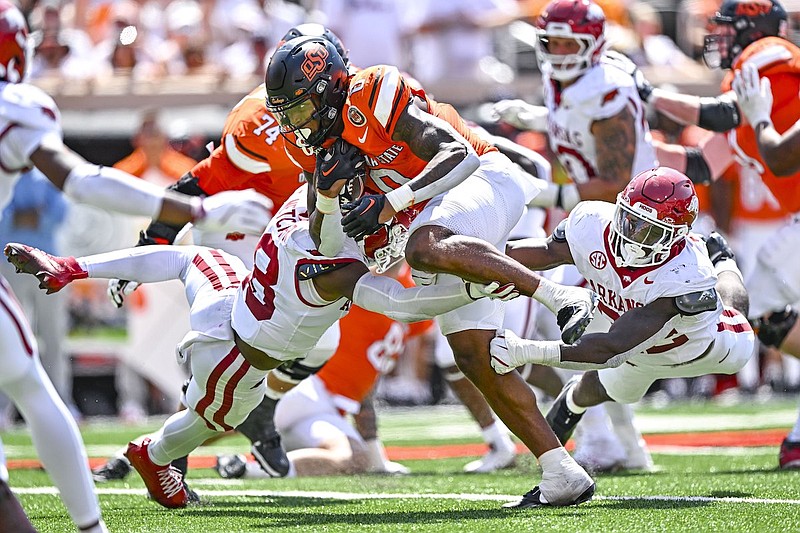
The general feel of Razorback Nation seems to be more positive after sleeping on Saturday’s 39-31 loss to Oklahoma State in Stillwater. The Hogs outplayed Oklahoma State for the most part, but failure to finish drives and avoid costly mistakes hurt them in the end against one of the Big 12 favorites.
Advanced Stats
Here’s the moment I know you’ve been waiting for:
PAIN.
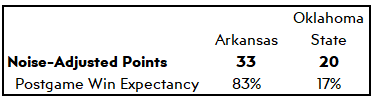
That’s what our model considers to be the game’s final score for ranking and predicting purposes. Basically, if you played this game 100 times, keeping the general flow of the game the same but treating the “noise” – fluky bounces, special teams, penalties, explosive plays – as mostly random variables, the average score would be 33-20 Arkansas and the Hogs would win 83% of the time.
The methodology we use is in this Pro Football Focus article, and I would note that PFF found that noise-canceled scores are more predictive of future performance than actual scores.
So what was changed? Again, the link has the methodology; I’m not manually changing things based on how I feel. But here are some events whose Expected Points Added (EPA) were up-weighted or down-weighted based on the formula. First, Arkansas’ offense gets credit for drives that covered a lot of ground but ultimately failed to score. As we’ll see below, the Hogs had no fewer than six drives get a first down inside the Oklahoma State 40 but come away with zero points. The Hogs end up getting partial credit for all of those. Additionally, Oklahoma State completely loses the pick-six (“noisy” play, in that it holds no predictive value) and only gets partial credit for two scoring drives that came after fumbles. The Cowboys also get punished for drives that were significantly aided by penalties.
To further argue for the legitimacy of our calculations, consider than ESPN advanced stats guru Bill Connelly basically ended up with the same postgame win expectancy despite a totally different approach:
So yeah. The simple reality is that sometimes you are the 83% and win when you should, and sometimes you are the 17% and lose when you shouldn’t. Arkansas has been the 17% a lot in recent years.
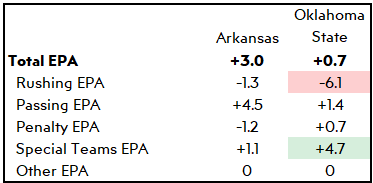
The Hogs lost about five points due to special teams and penalties, and I’m not so sure that figure shouldn’t be even higher. But ultimately, the main reason the Hogs couldn’t put the Pokes away is found in the offensive numbers.
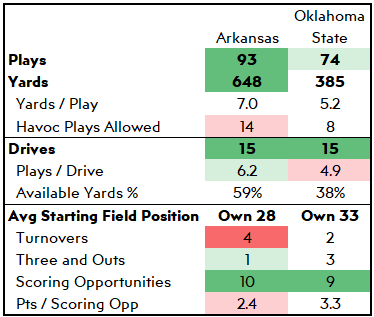
The little things always matter, and they never stop mattering, even if you put up 648 yards of offense. The three red numbers on Arkansas’ side tell an unfortunate story. There are four turnovers (the model counts turnovers on downs as turnovers). There were 14 havoc plays, many of them self-inflicted due to broken plays or dropped snaps. (“Havoc” plays are lost yardage, turnovers, fumbles, and pass breakups.)
And the Hogs had 10 scoring opportunities – drives that get a first down inside the opponent 40 – and they ended up with 24 points on those drives. Here’s how they went:
- Punt (after sack to move out of field goal range)
- Touchdown
- Touchdown
- Interception
- Touchdown
- Missed Field Goal
- Downs
- Field Goal
- Missed Field Goal (overtime)
- Downs (overtime)
You can move the ball all over the field, but if you can’t finish drives with points – especially touchdowns – you can’t win. You see two of the turnovers there (the model didn’t count the final turnover on downs as an actual turnover because it ended the game), and the 14 havoc plays played a major role in killing those drives.
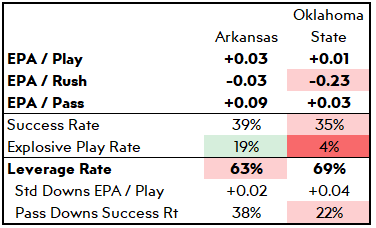
Arkansas wasn’t overly efficient, but as I wrote this week over at Best of Arkansas Sports, they dominated the big play game, as we could have expected. The Cowboys had only three big plays, struggled in must-pass situations, and never could run the ball. That was the recipe for success.
Arkansas’ offense only had a 39% success rate and was behind the chains too often (63% leverage), but almost one-fifth of Arkansas plays were explosives (run of 10+ yards or pass of 20+). I would expect that to continue based on Petrino’s downfield passing attack. The key will be avoiding the massive negative play rate moving forward.
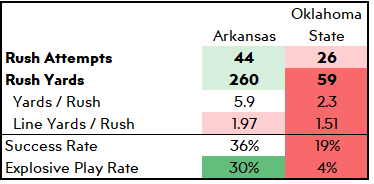
It’s sickening that Arkansas’ defense put all that red up against a Heisman candidate running back and couldn’t win the game. Arkansas’ run defense was solid last year, and so far it looks absolutely filthy this year. When you have quarterbacks like Payton Thorne and Blake Shapen coming up on the schedule, that bodes really well.
Petrino has already completely reversed the Dan Enos experience. Enos wanted a conservative, efficiency-based, low-explosive rushing attack, and it failed miserably due to an inability of the line to open up holes. Despite shaky blocking at times (Arkansas’ 1.97 line yards per rush wasn’t great), the Hogs saw nearly a third of their runs gain 10+ yards. That’s one way to make the run game dangerous.
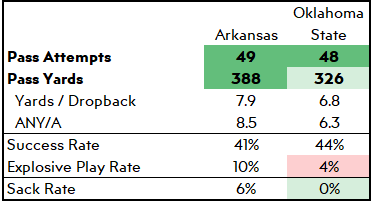
I would have liked to see more explosives in the pass game. It felt like Petrino spent much of the second half trying to create explosives with screen passes, and it never quite worked out. Oklahoma State’s defense was just too smart.
On the other side, failing to get a sack stinks. Oklahoma State has one of the better pass-protecting lines in the country, but Arkansas is supposed to have an elite pass rush. Early on, Hog defensive stops were led by run defense and good secondary play; eventually, the Cowboys started scheming receivers open. The Razorback pass rush never seriously affected things.
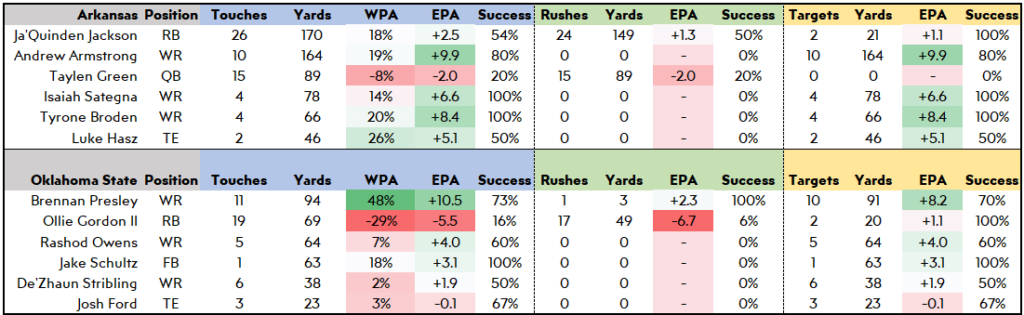
Hats off to Cowboy WR Brennan Presley, who generated +48% win probability for his team. Oklahoma State got him lined up against Doneiko Slaughter in the second half, and Slaughter couldn’t stay with him. Being able to cover slot receivers has been a problem for Arkansas for as long as I’ve been watching games.
Up Next
I don’t know if these numbers make you feel better are worse, but they are what they are. At some, “predictive future value” has to materialize. It will need to materialize quickly for the Razorbacks, who have some key games coming up.
UAB is first, on Saturday in Fayetteville. The Blazers were drilled 32-6 by UL Monroe and seem likely to present much of a challenge. But after that is a huge showdown against Auburn, which I’d argue is a must-win. It’s hard to see optimism holding through a loss to a struggling Auburn team.
Thanks for reading! Be sure to follow us on Twitter and on Facebook.
The latest from Fayette Villains, straight to your inbox
Enter your email to subscribe and receive new post alerts and other updates. You can unsubscribe at any time.
“ Arkansas has been the 17% a lot in recent years.”
I don’t know. If you constantly end up in the low probability side of the model, it’s more likely that the model is wrong than that you are extremely unlucky
Just dismissing poor special teams play out of hand, when it is consistently poor, seems misguided. I’d expect past performance in that phase to be predictive of future results as long as Scott Fountain is coaching them. It’s most just random.
You’re just stating the subtext outline, I don’t think you’re actually disagreeing here.
I’m specifically disagreeing that special teams play, consistently poor under Fountain, should be dismissed from the model
you’re misunderstanding how stats and probabilities work.
No, I’m not. I’m highlighting the problem of applying a general model, which works great covering 100 teams in a 100 games, to a specific team in a specific game.
Take an extreme example where a team said they would, on purpose, fumble every punt *on purpose*. Would it still make sense just to throw special teams plays out of the model? Of course not
Take the finance model CAPM. Even assuming it accurately describes markets, it doesn’t even try to describe the behavior of a particular company.
The idiosyncrasies of a particular unit (team, company) can overwhelm the predictability of a general model.
If you *keep* being on the very low probability side of the equation, it’s more likely you are misapplying the model than that you are extremely unlucky
Would be curious to see if there is a luck stat like there is in CBB analytics that applies to close game performance, and if so, where Arkansas has fallen on that side of the equation over the years. As a fan, it certainly feels like we’ve been on the wrong end of stuff a lot, but would be curious to see where the numbers lie.